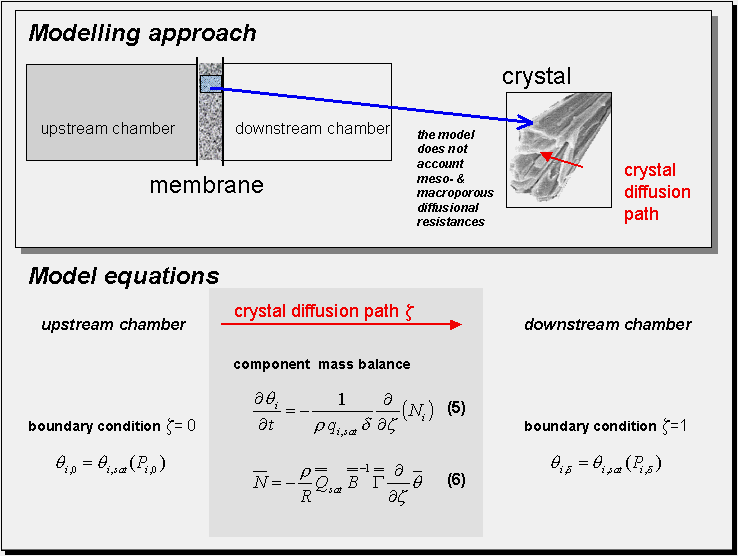
Brief review on membrane model:
The figure below shows the basic model for permeation of a mixture across a zeolite membrane. The chambers adjunct to the membrane are assumed to be in a quasi-steady state with either constant partial pressure or constant total pressure. The governing equations are shown in the figure below.

A detailed description of the model and further reading can be found in Krishna and Baur (2003).
Choice of thermodynamic properties: Strictly speaking, the user can independently combine the methods for computing the isotherm, the thermodynamic correction factor and the square matrix of inverse Maxwell-Stefan coefficients. Below we list the implemented options:
- Methods for the isotherms:
- Multicomponent Langmuir isotherm (single site)
- Ideal Adsorbed Solution (IAS) theory
- Real Adsorbed Solution (RAS) theory
- Methods for the thermodynamic correction factor:
- Unity matrix (no correction)
- Based on multicomponent Langmuir isotherm (single site)
- Based on IAS theory
- Based on RAS theory
- Methods for the square matrix of inverse
Maxwell-Stefan coefficients:
- No binary diffusional interactions
- Binary interaction estimated from Vignes equation
Numerical aspects: In order to solve the set of equations we discretized the partial differential equations using a finite volume discretization approach. In particular, the computation of the thermodynamic correction factor is computationally cost intensive and requires special attention.Our approach to compute the thermodynamic correction factor is based on the residual vector for the isotherm. The entire set of equations is solved using a sparse matrix DAE-solver.
Return to contents or next: true moving bed
